
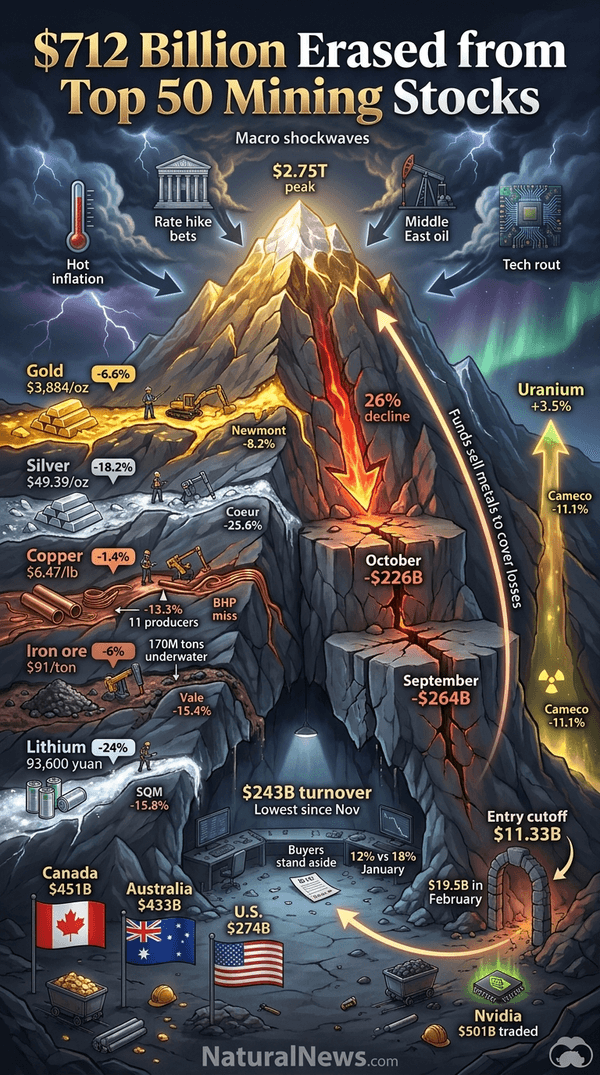
October accounted for $226 billion of the loss, a 10% decline, following a $264 billion drop in September, according to MINING.COM. The two-month slide has left the ranking worth $108 billion less than at the end of 2025, marking the first time this year the list has been in the red.
The report attributed the declines to hotter U.S. inflation data that hardened bets on another Federal Reserve rate hike, higher oil prices tied to the Middle East conflict, and a rout in technology stocks during the final week of October that forced funds to sell metals to cover losses elsewhere.
Gold and Silver Miners Post October Declines
Gold ended October at $3,884 an ounce, down 6.6% and the first month-end close below $4,000 since September last year, according to the report. The metal slid to a one-year low on the last trading day and is now 10% lower in 2026, its worst October since 2008, the report stated.
The 16 gold miners in the ranking gave up $55 billion, or 9.9%, and were worth $500 billion combined, MINING.COM stated. Newmont lost 8.2% despite beating third-quarter profit estimates, while Agnico Eagle fell 9.9% and Barrick dropped 9.1%, leaving the three largest gold miners all in the red for the year. Kinross fell 17.3% and AngloGold Ashanti fell 15.8%.
Silver fell 18.2% to $49.39 an ounce, below $50 for the first time since October 2025 and 58% beneath its January high, according to the report. Coeur Mining fell 25.6%, the worst performer in the ranking, while Fresnillo lost 17.2% and Pan American Silver lost 16.6%. Gold Fields chief executive Mike Fraser said in mid-October that Northern Star must first show it is open to a deal before a higher offer, the report stated. Gold Fields fell 8.8% in the month.
Copper Producers Lose $69 Billion as Equities Diverge From Metal
The copper price was $6.47 a pound in October, 1.4% below where it started the month but still up 15% for the year, according to the report. The 11 copper producers in the ranking lost $69 billion, a 13.3% decline and the largest dollar loss of any sector, MINING.COM stated.
BHP missed quarterly copper estimates after a fatal accident and weather stoppages at Escondida, the report said. Antofagasta lost 16.1% after a weaker 2027 production outlook and higher cost guidance, while Anglo American reported a 5% drop in copper output from Chile's winter storms. Southern Copper lost 12.4% and $21 billion, and Freeport-McMoRan fell 10.8% to $89.7 billion, dropping out of the $100 billion club despite beating third-quarter profit estimates.
The World Bank lifted its 2027 copper forecast by 18% to $13,000 a ton, according to the report. The report described copper equities as now priced for a metal well below where it trades, a gap the ranking has tracked since the summer.
Iron Ore and Lithium Decline; Uranium Rises
Iron ore slid 6% to $91 a ton and spent the last days of October below $90, a level UBS says puts up to 170 million tons of supply underwater, according to the report. Vale fell 15.4% after third-quarter core profit tumbled 20% and output missed forecasts, Fortescue lost 12.1%, and Rio Tinto fell 12.6% and $20 billion.
Lithium carbonate fell another 24% to 93,600 yuan ($14,050) a ton, hitting a 10-month low early in the month, the report stated. SQM, the ranking's only lithium producer, lost 15.8%, and Albemarle sits 53rd at $10.7 billion. Rio Tinto committed a further $1.4 billion to lithium in Argentina during the month.
Uranium was the only metal to rise, up 3.5% to $92.55 a pound, but Cameco still fell 11.1%, according to MINING.COM. Sustained supply-side constraints have been a recurring theme across mineral markets as demand for critical materials grows.
Trading Volume Falls as Ranking Cutoff Drops
Shares in the 50 companies worth $243 billion changed hands in October, the lowest monthly turnover since November last year and barely half the $454 billion traded in January, according to the report. Measured against the value of the companies, 12% of the ranking turned over in October, compared with 18% in January and 19% in March, MINING.COM stated.
The report described the $490 billion lost over the past two months as coming with buyers standing aside rather than holders selling in size, a different kind of correction from the one in March. For scale, Nvidia alone traded $501 billion in October, twice the 50 miners combined.
The 50th company in the ranking was worth $11.33 billion, the lowest cutoff since August 2025 and $8 billion below the $19.5 billion needed to make the list in February, according to the report. Canada remained the most valuable mining address at $451 billion, followed by Australia at $433 billion and the United States at $274 billion.
Miners Trade Near One-Year Lows as Buyers Step Aside
The report's authors described the October decline as part of a broader repricing across the mining sector, with gold and silver producers hit hardest and the fiftieth company smaller than at any time since August 2025. According to MINING.COM, the world's 50 most valuable mining stocks trade near one-year lows after losing 26% since the February peak [1].
The drop occurred amid a broader market environment in which technology stocks sold off sharply and investors pulled back from commodities. Analysis of oil and gas stock returns has shown that exchange rates, crude prices and interest rates each have large and significant effects on share prices, a dynamic that extends across resource equities [2].
References
- $712 billion wiped off world's biggest mining companies .... https://www.mining.com/712-billion-wiped-off-worlds-biggest-mining-companies-since-the-start-of-the-iran-war/
- Risk factors in stock returns of Canadian oil and gas companies. Energy Economics 23 2001
Explainer Infographic
Source link